
How to debug Hotwire Native apps with Safari
Hotwire Native is a framework for building high-fidelity mobile apps powered by mobile web content. It enables small teams to build big apps by reusing most of your web content in hybrid iOS apps.
Even though the rendered content is boring ol’ HTML, there is still a bit of JavaScript glue holding it all together. For example, when a link is clicked Hotwire hijacks it to perform a fetch request instead of the embedded browser navigating to the new page.
There are also times where a developer might want to bridge the gap to native Swift code when a web button or link is tapped. A common approach is to fire a JavaScript message for the client to receive and call into a native SDK.
This works great when everything goes well. But there are times when things don’t work perfectly and a JavaScript error is raised.
Unfortunately, Xcode doesn’t relay these error messages to the console. So things look like they are silently failing.
But all hope is not lost! Safari’s Developer Mode lets us attach a debug session directly to the embedded web view. Granting us the full web dev experience we are used to: an interactive console, HTML/CSS debugging, local storage spelunking, and more.
How to attach the Safari debugger to the simulator
First, enable the inspection of web content in your app. This was recently added in iOS 16.4 so make sure to check for API availability, like so.
let webView = WKWebView()
if #available(iOS 16.4, *) {
    webView.isInspectable = true
}

let session = Session(webView: webView)
Then launch your Turbo Native app in the simulator.
Need an example to play with? Try the demo app from the turbo-ios package.
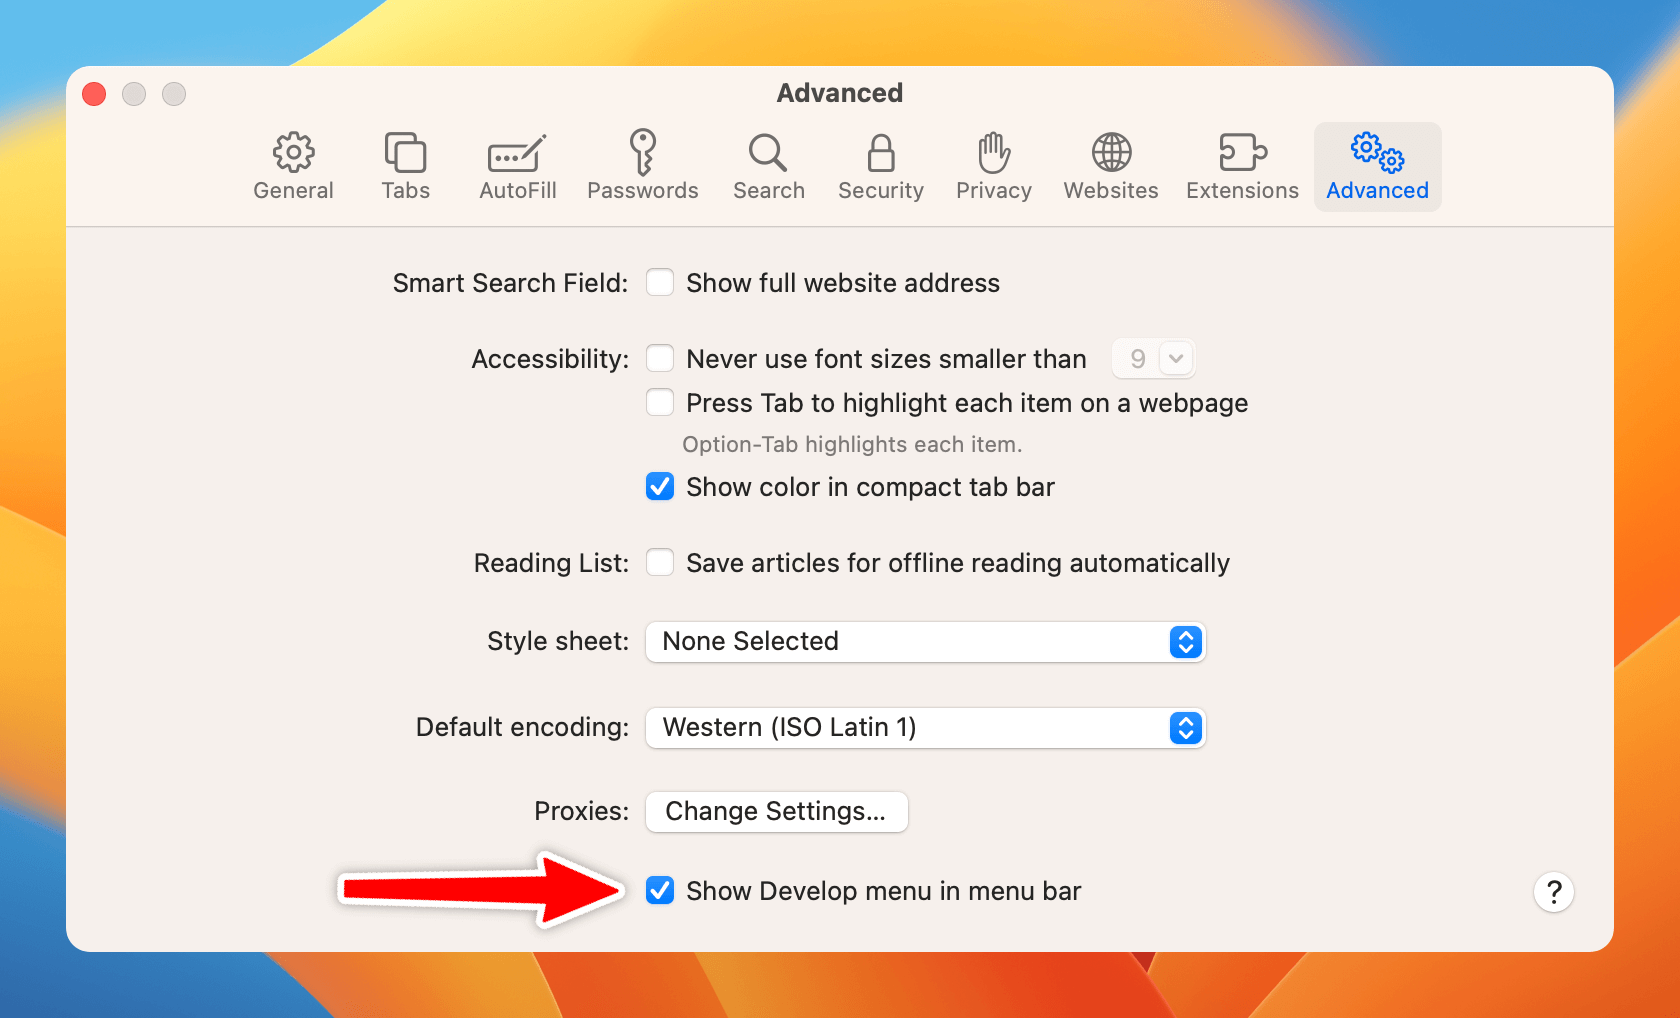
Enable Developer Mode in Safari by opening Preferences (⌘,) and navigating to the Advanced tab. Check the box for “Show Develop menu in the menu bar”.
In Safari, click the Develop menu item and look for the name of your simulator. Then click the web view rendering the content you want to debug. Here I’m connecting to the web view rendering localhost from an iPhone 14 Pro running iOS 16.0.
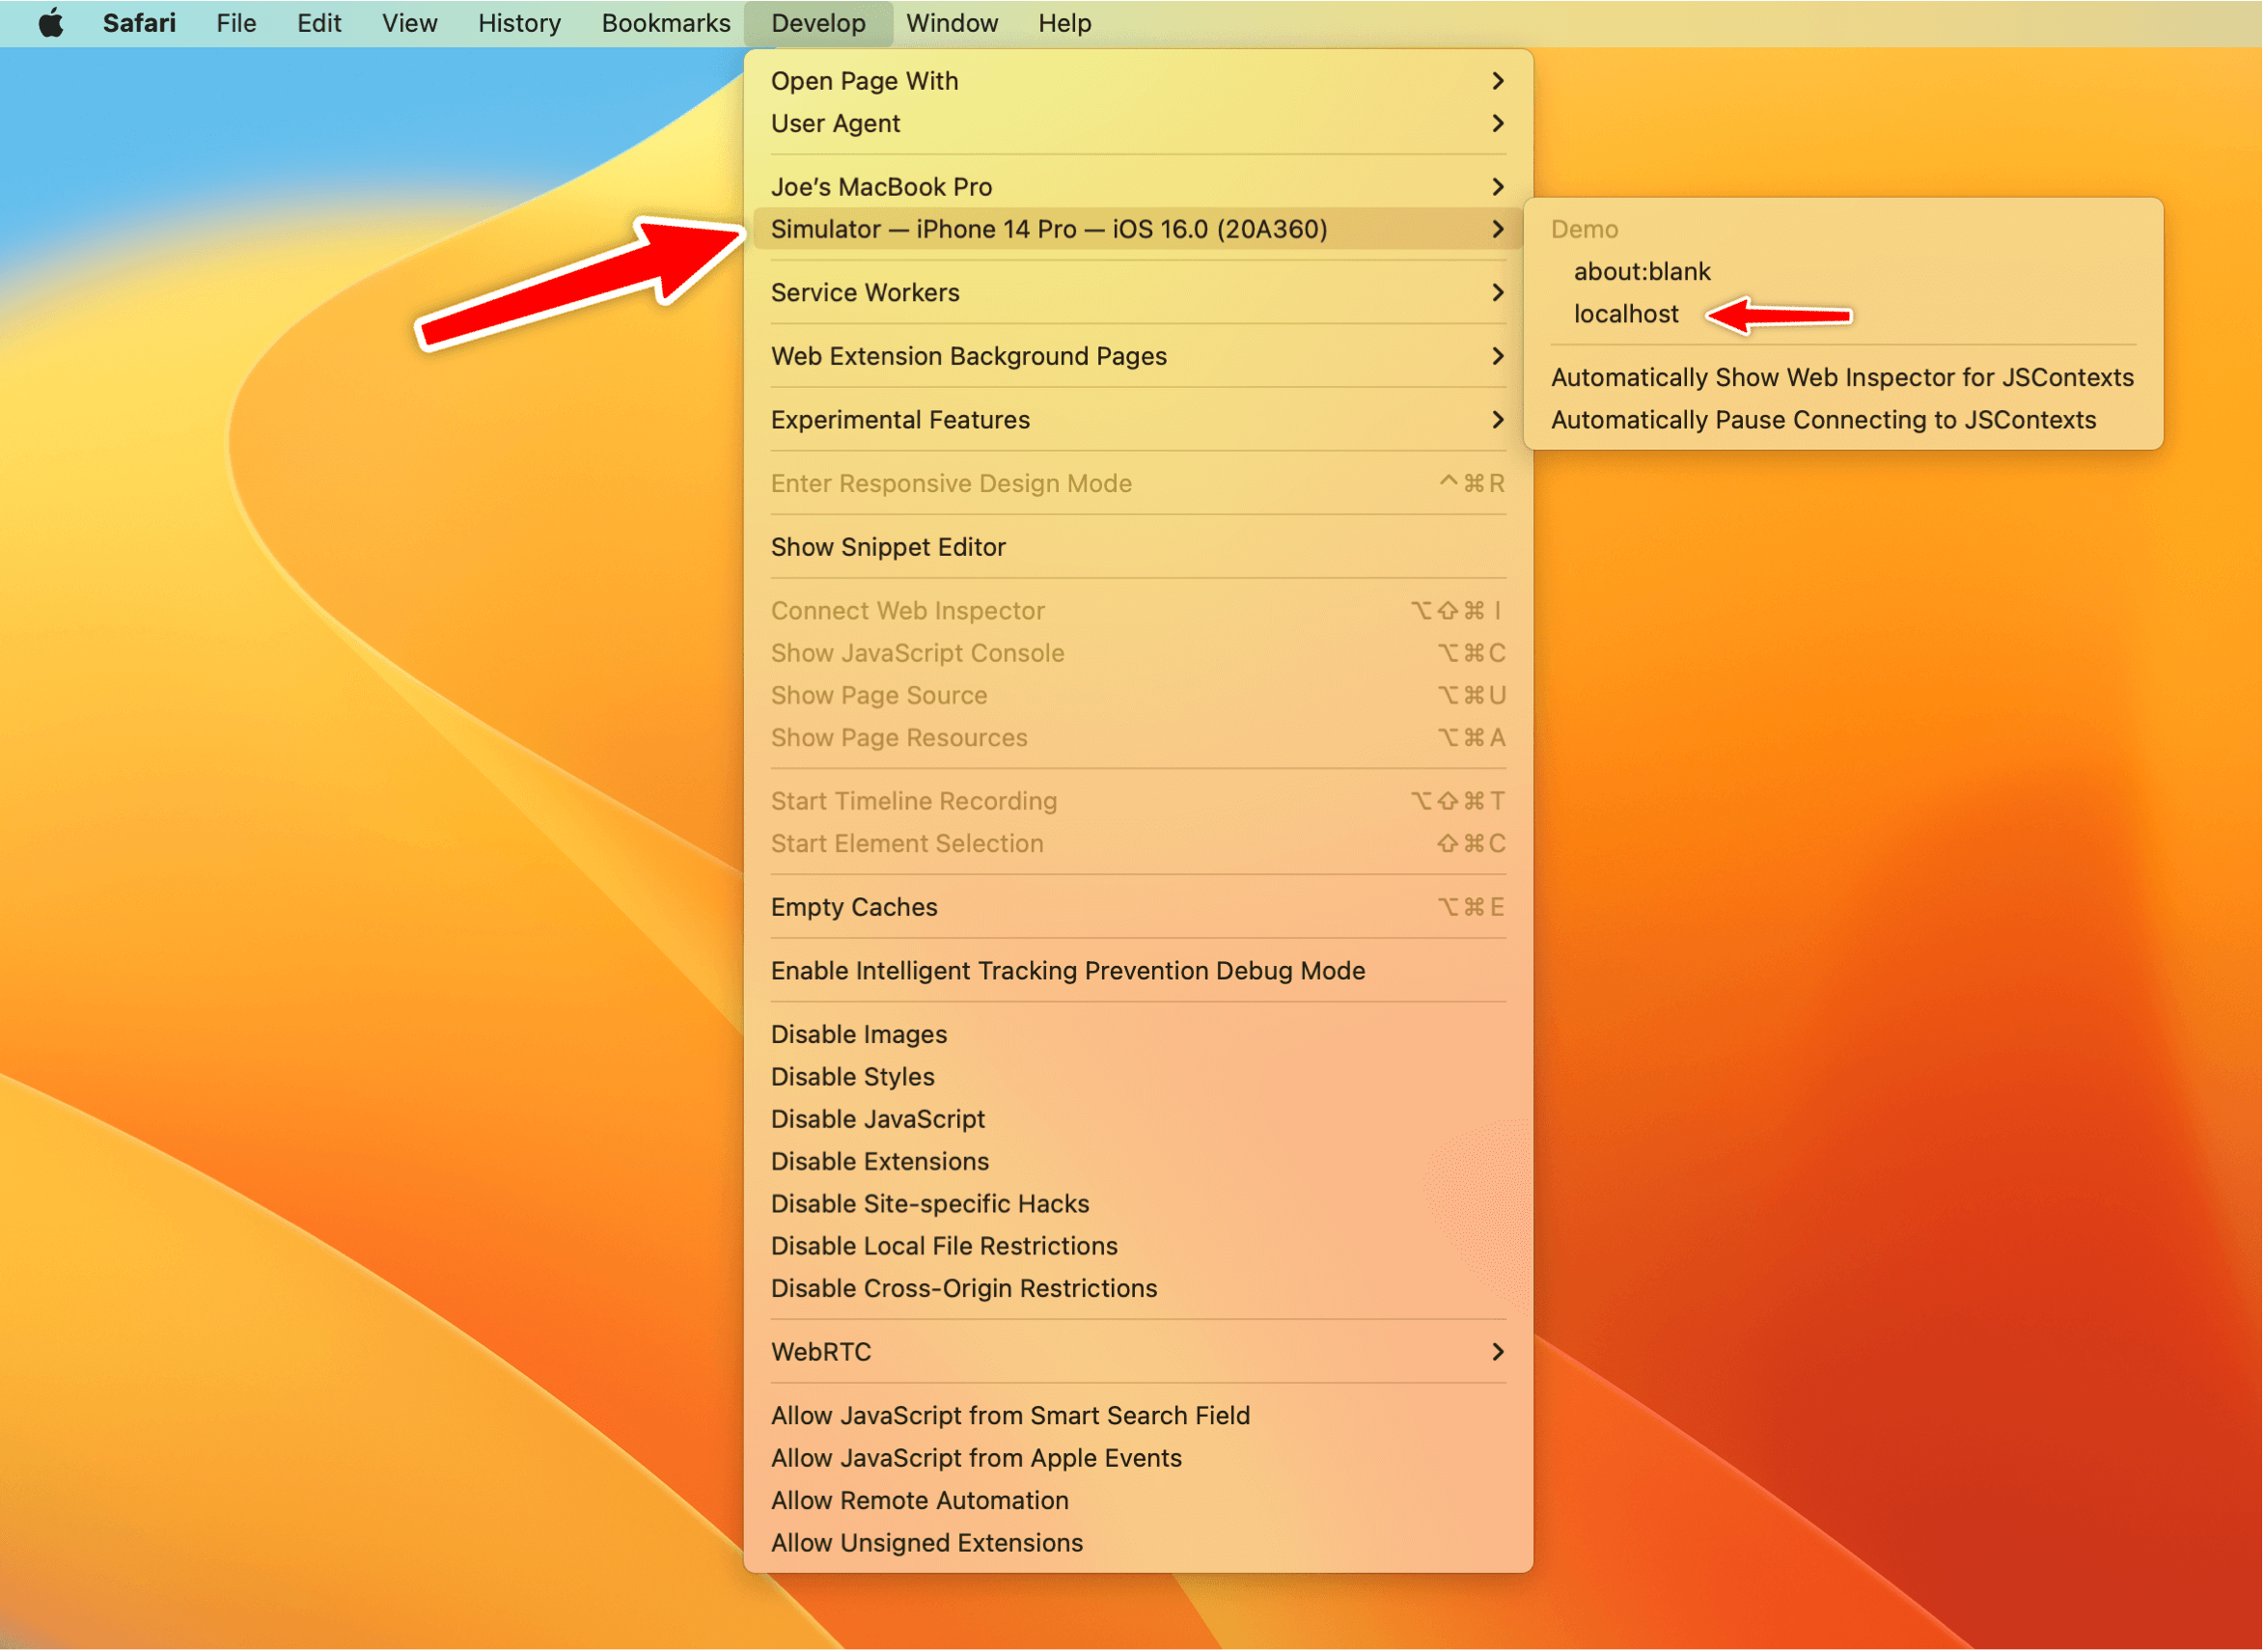
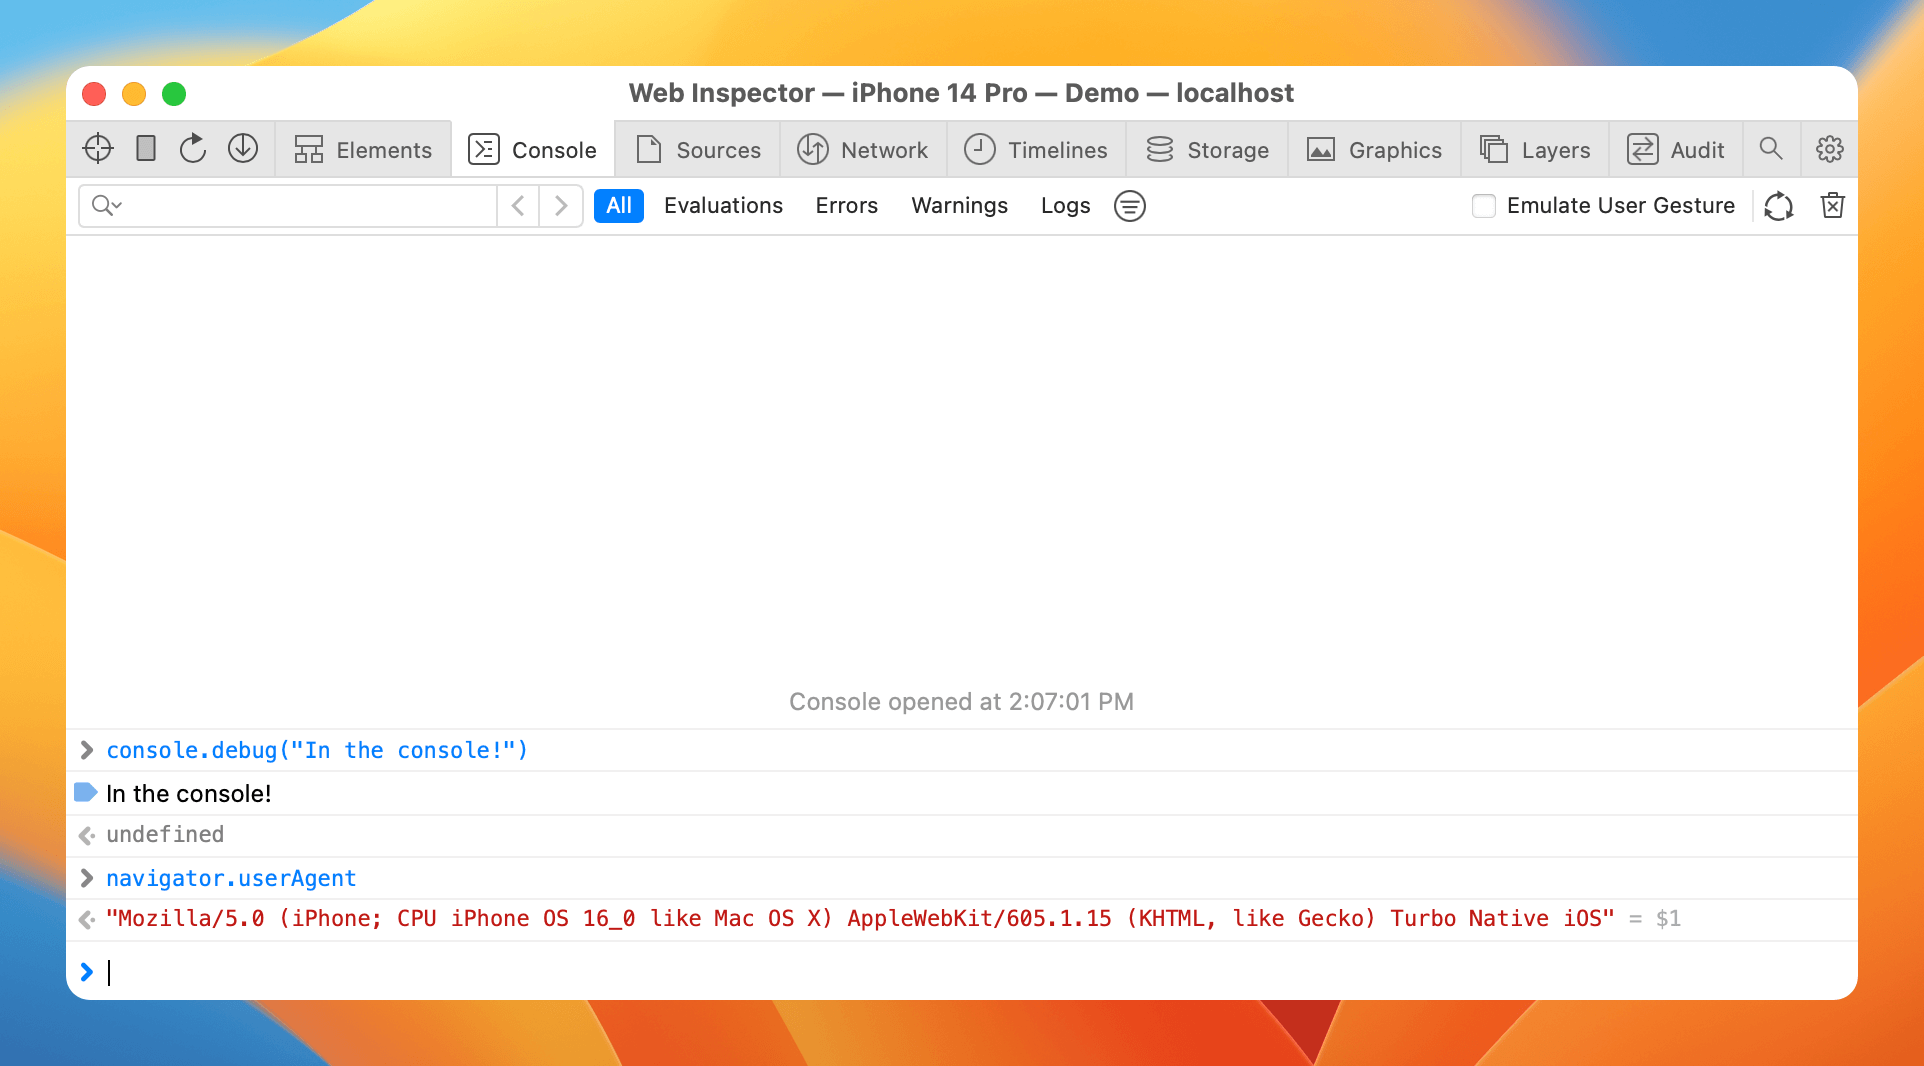
Now we have a full Safari debug session!
Which web view should I connect to?
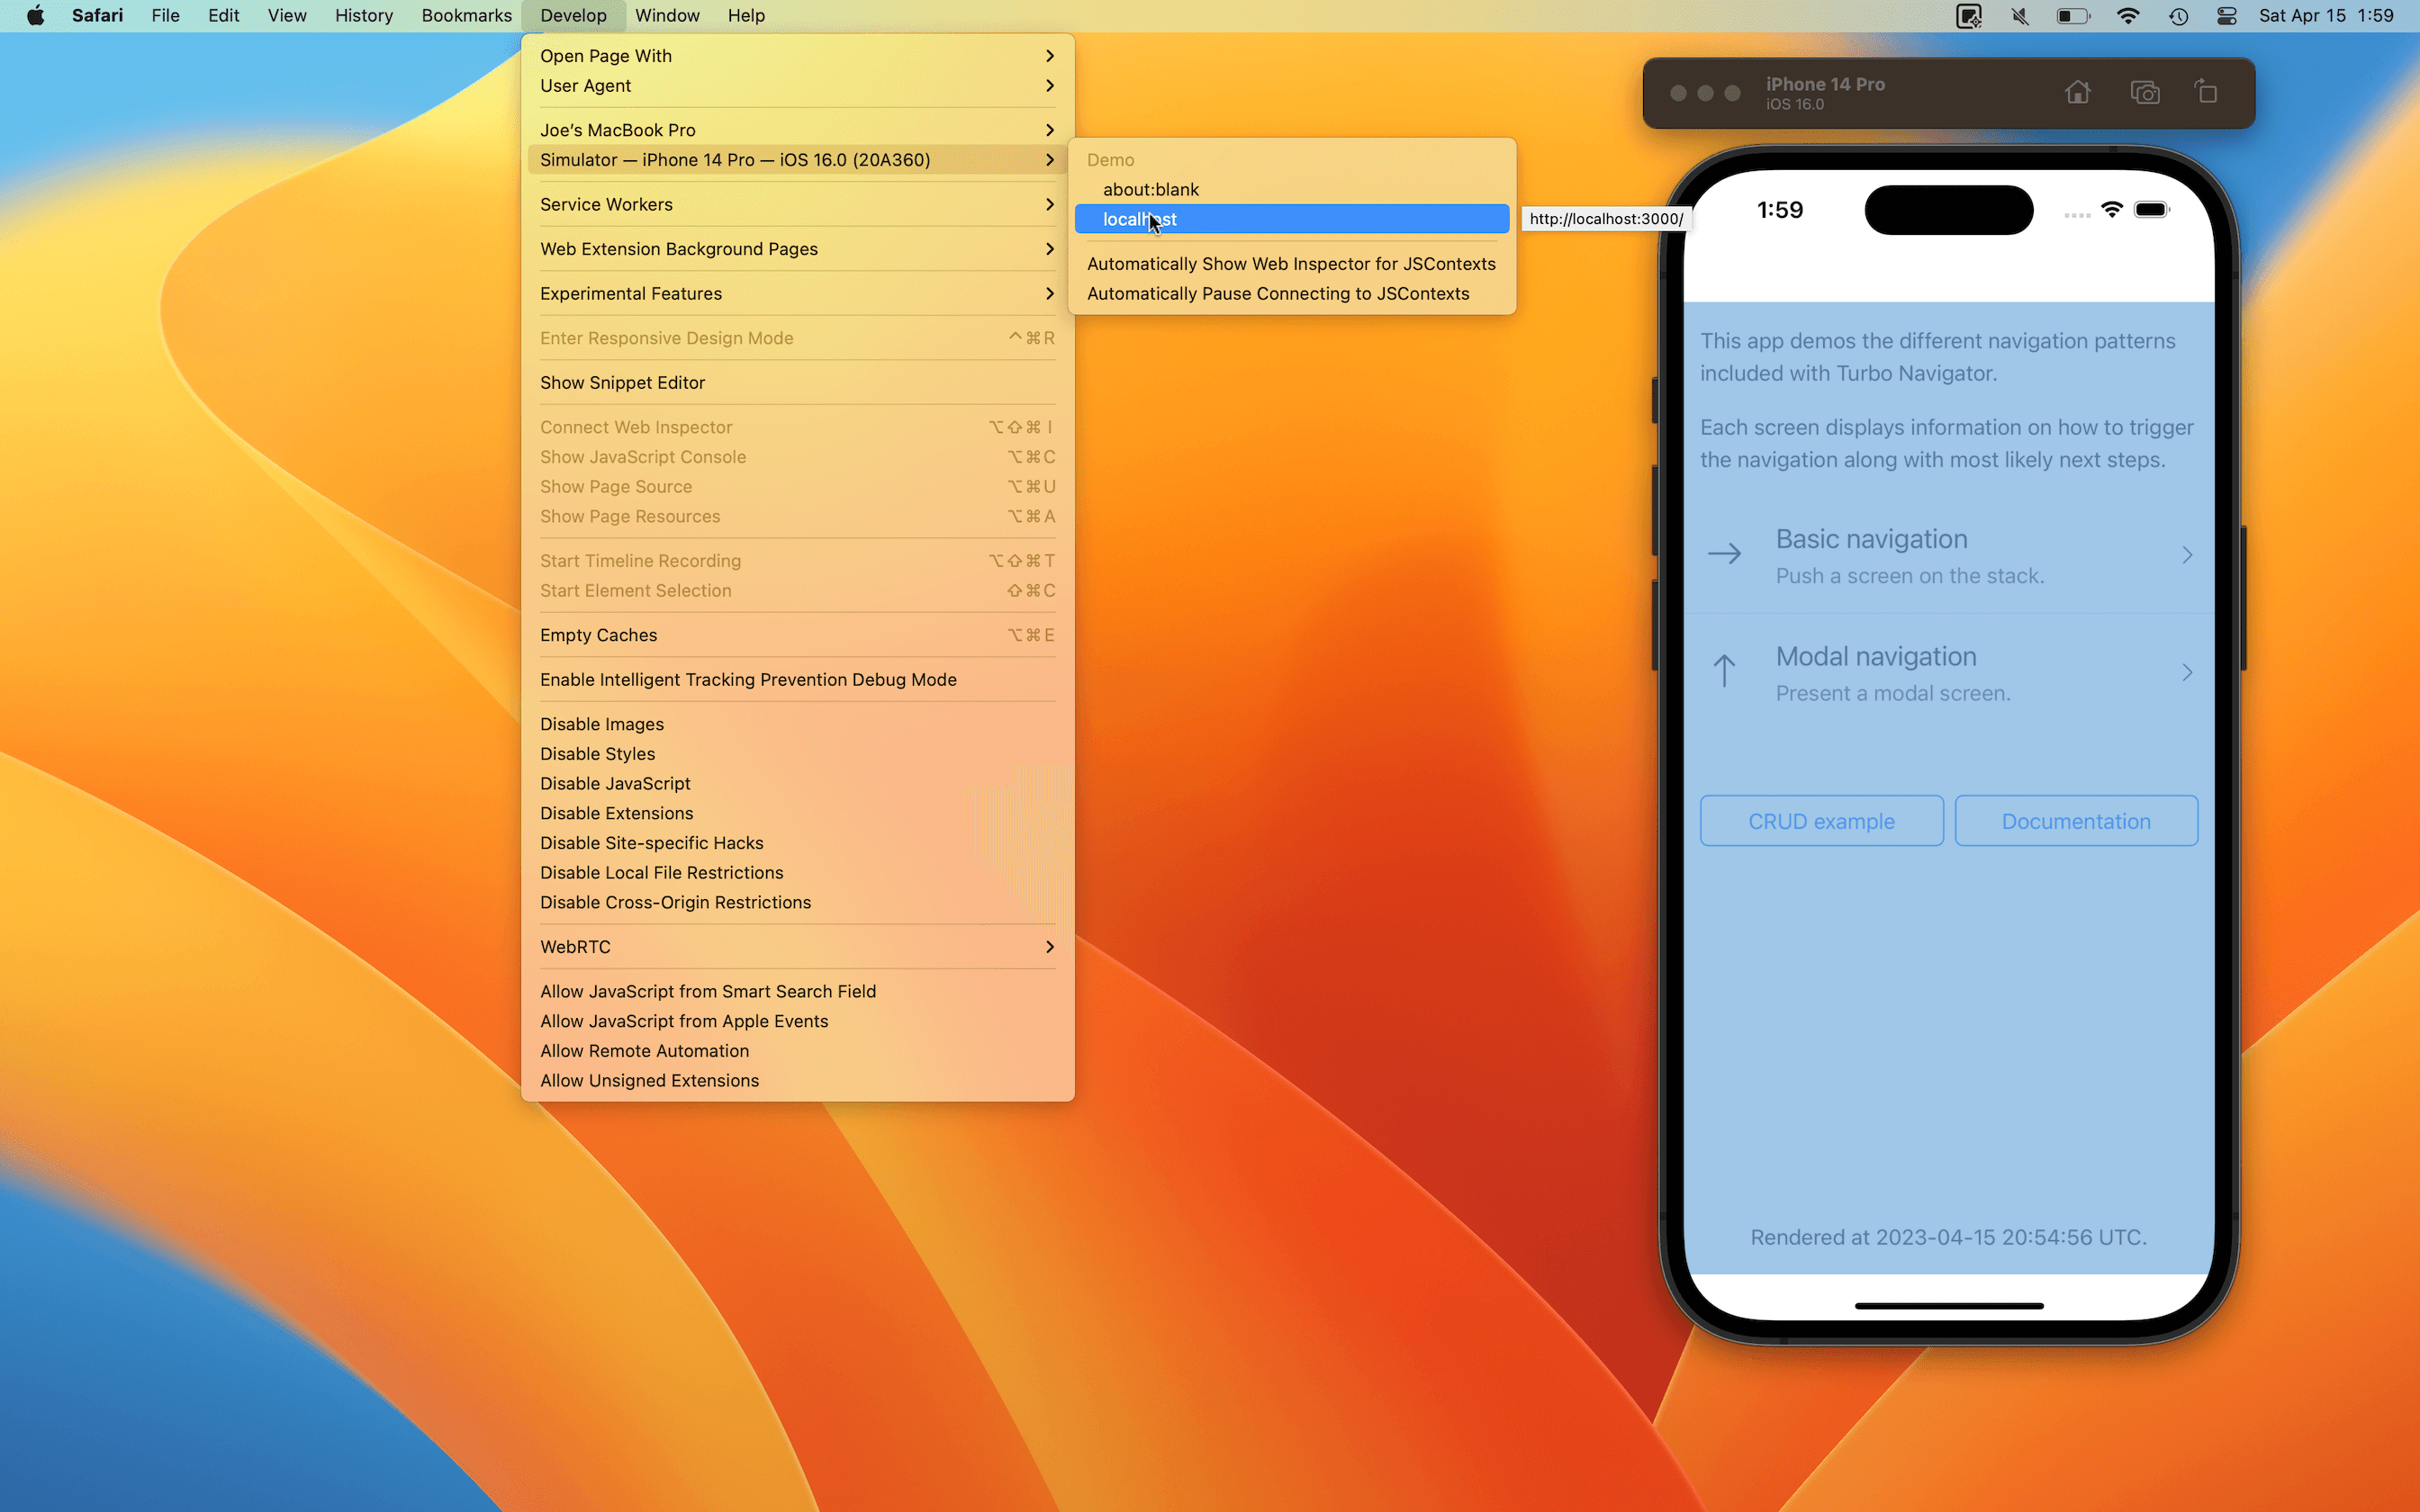
If you can keep your simulator visible you’ll notice the web view highlights in light blue when you hover over it. (Hint: Minimize all windows before switching focus to Safari.)
Here’s what happens when I highlight the web view associate with the Turbo Navigator demo I’m running in the simulator.
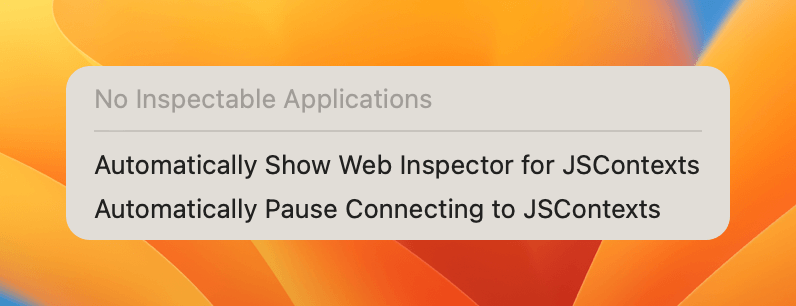
How to debug “No Inspectable Applications”?
I see “No Inspectable Applications” fairly often when trying to attach to the simulator’s web view. Here are some tips for getting it working again.
First, ensure you are running the latest versions of Safari, Xcode, and iOS.
Second, try restarting the simulator, Safari, and Xcode in different orders. Sometimes launching the app after Safari is open works. Other times it works the other way around. Experiment and see what works for your machine!
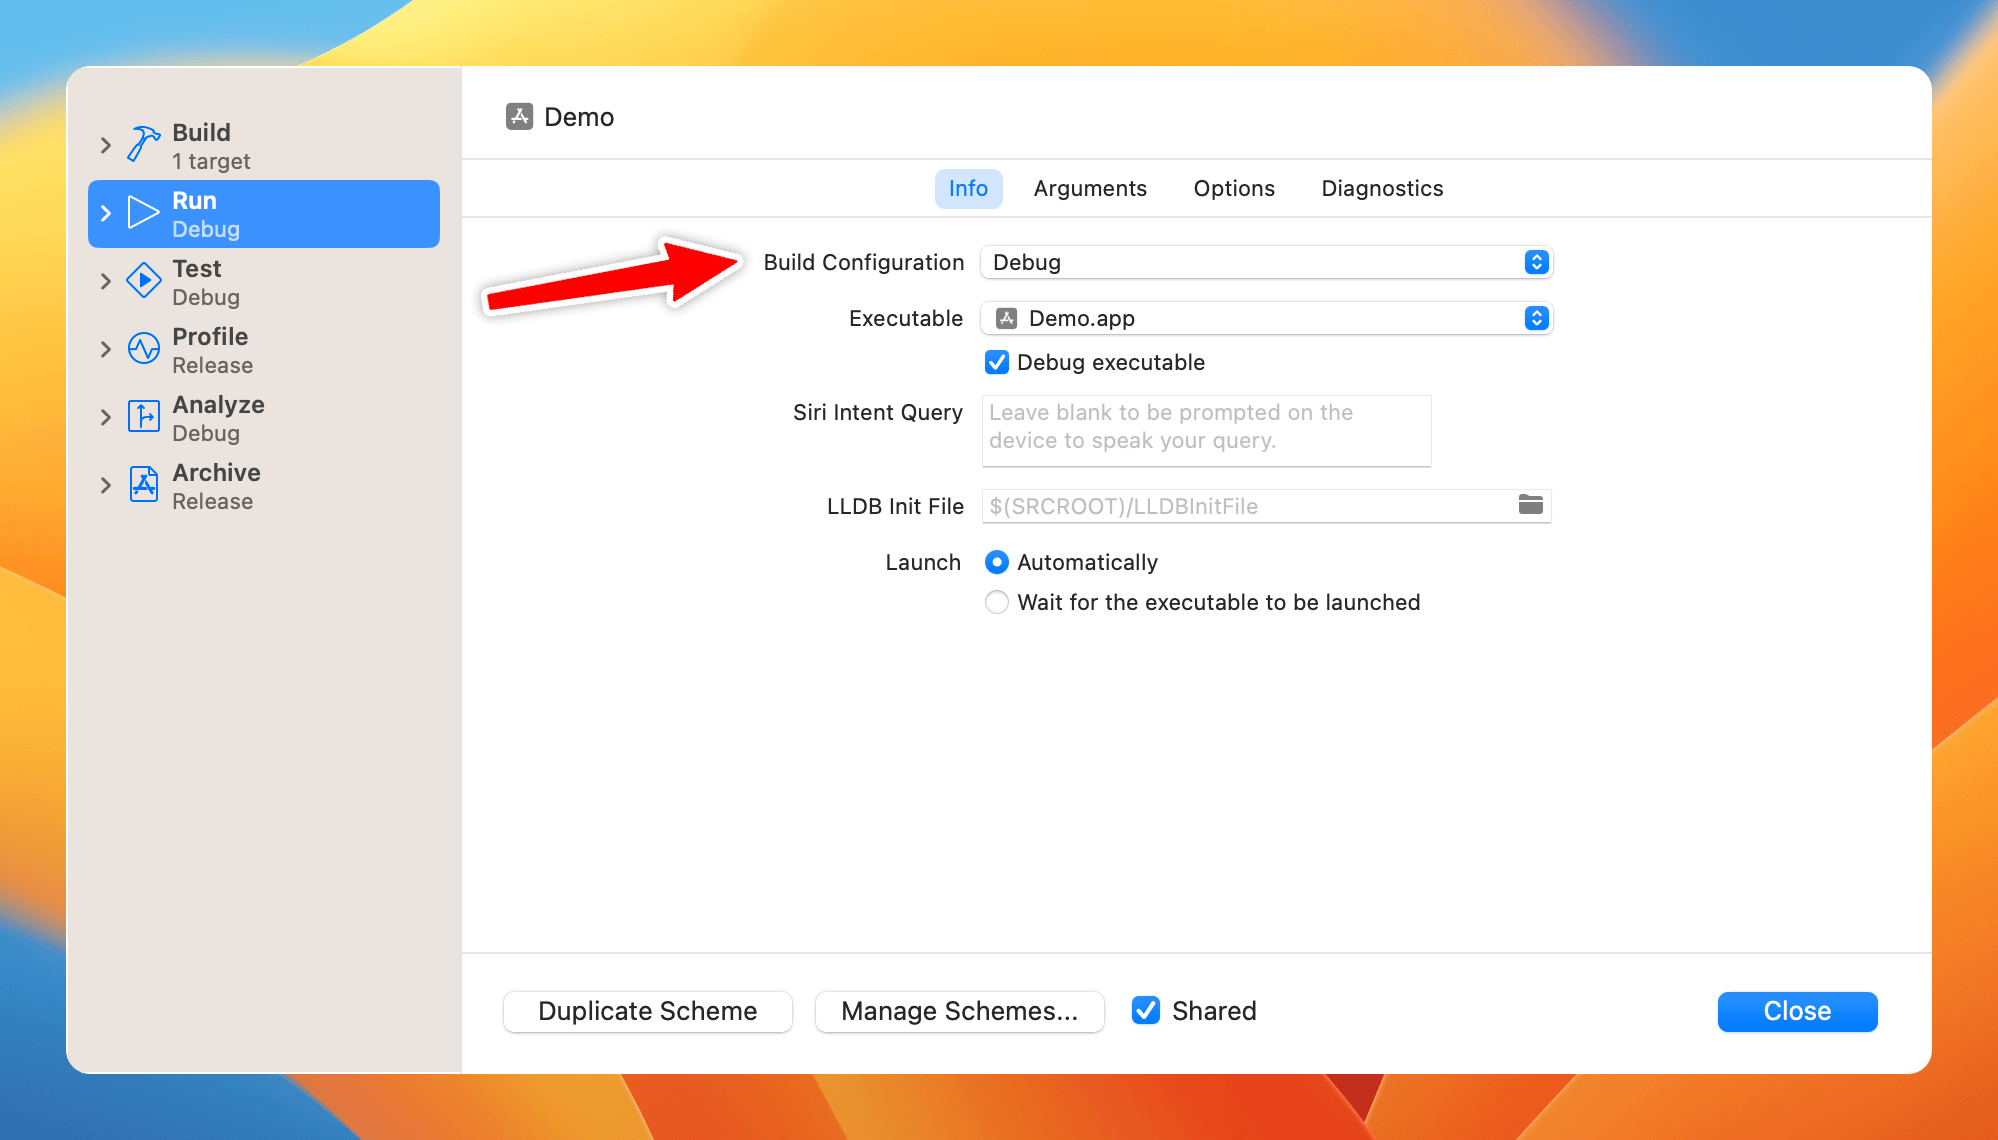
Finally, ensure your app is running in Debug mode and not Release. This can be verified in the scheme (⌘<) in Xcode.
Good luck debugging your Hotwire Native app! If you need a hand launching your Rails app to the App Store check out how I can help.
P.S. My newsletter subscribers got a sneak peek of this article before it was published. Subscribe below to be the first to know about my new posts, courses, and libraries.